Friday, November 17, 2006
Divergent Paths - 1


Saturday, October 28, 2006
Options Seminars
1. The Delta Risk - The risk of share price movements affecting options prices
2. The Vega Risk - The rapidity of price change of share prices causing the options price to change
3. The Theta Risk - The time factor which is basically the interest cost.
I stuck to pure stock buying for the simple reason that it had only the Delta Risk. Vega risk wasn't measured or was smoothened away. The theta risk was absent since I used only own money and no borrowed money. (It could be argued that there is an implied cost to own money - the opportunity cost and that Theta risk is not entirely absent.)
Steve Meizinger of OIC did a great job of laying out the advantages of a spread. I was surprised to learn that spreads could be used to take exposure to the right kind of risk and hence be rewarded for taking the right position. For instance, you could build a position on INFY by buying a 45 call and selling a 55 call for the same expiration. This would mean that the move from $45 and up less the options premium paid would be the profit. Using options means that the capital outlay would be much lower and the returns higher per $ capital invested.
The flip side is that the whole capital could be lost. However, since it is a spread we are discussing the loss is also limited to the net options premium paid.
In this example outlined, the volatility risk and theta risk between 45 and 55 call would almost even out to zero. The only risk exposed would be the Delta risk, which is what you are trying to make use of when you invest in a share.
It gets a little complicated when you buy a LEAP and start writing options against it. It is almost similar to buying a stock and writing calls against it. The risks are much higher in the former case; so are the returns.
I'll post on my ventures into this field.
Sunday, September 24, 2006
The Poker Face of Wall Street - Review
I had an opportunity to read “The Poker Face of Wall Street” by Aaron Brown. After reading, I still couldn’t figure out whether it was a case of the man with the hammer seeing nails everywhere or not. However, there are some good insights into risk, chance and life, in general in the book. A few that I liked follow:-
Risk Rules:-
- Do your homework – You must avoid unnecessary risks and, just as important, avoid taking risks blindly when they can be calculated….you must take risks only when you’re getting paid enough to do it.
- Strike for Success – risk taking requires “Prudence and Courage; Prudence in contemplation, Courage in execution.” If you decide to act, act quickly and decisively. Go for maximum success, not minimum risk….”From this moment, the very firstlings of my heart shall be the firstlings of my hand.” – quoting Macbeth
- Make the tough fold – “Your first loss is your least loss”….If the result of that calculation suggests that you are not getting sufficient odds to justify further investment, give up just as quickly and decisively as you began.
- Plan B is You. The only assets you can count on after a loss are the ones inside You: your character, your talents and your will.
Quoting David Sklansky’s famous Fundamental Theorem of Poker:
"Every time you play a hand differently from the way you would have played it if you could see all your opponents’ card, they gain; and everytime you play your hand the same way you would have played it if you could see all their cards, they lose. Conversely, everytime opponents play their hands differently from the way they would have if they could see all your cards, you gain; and everytime they play their hands the same way they would have played if they could see all your cards, you lose."
A Brief History of Risk Denial:
- All our financial products are pure, with no artificial risk added
- It’s capital formation, not gambling
- Traders are order clerks
- It’s not gambling; it’s hedging
- Insurance payouts go for sensible investments, while lottery winners waste their payout.
- We’re not gambling, we are investing
- The ups and downs of the stock market just reflect the ups and downs of the economy
- Governments set interest and foreign exchange rates
- Derivatives aren’t gambles
Scanning for Options trading opportunities – quick tips:-
Parity – Look for a situation where strike price plus call price minus put price is significantly different from the price of the underlying
Verticals – Buying a call or put, and selling the same kind of option on the same underlying with the same expiry, but at a different strike. When a stock is selling at the midpoint of a vertical, the vertical has to be worth very close to half the spread.
Calendar – buying one option and selling another of the same type, with the same underlying and strike but a different expiry. Longer dated options are more valuable than shorter dated ones. The spread is most valuable near the current stock price and should decline in price for options at higher and lower strikes.
“Everyone is an opponent-not a vindictive opponent; just a decision-making entity maximizing its own utility function without regard for your welfare.”
“The ultimate scarce resource in cognitive processing is attention. Things are going on right now that we’re not paying attention to. Information is flowing all around us, ignored. The trade-off is between attention and memory. A court stenographer can record every word everyone says in court, while reading a novel, but ask her what happened ten seconds ago and you get a blank stare. Attention is the tool you need to get information. People are using unconscious strategies because they don’t have the attention to solve everything optimally. We can predict their actions using simple game models because they’re not paying attention, not because they are.” quoting Colin Camerer
Saturday, September 23, 2006
Cost Inflation Index grows five-fold in 25 years??
This headline recently caught my eye - "Cost Inflation Index grows five-fold in 25 years" ?? The author is someone I respect for his good writing in Business Line. I have enjoyed his articles while I was a CA Student in the late 90s. I still do respect the quality of his writing. However, the tilt of this particular article made me wonder.
I wanted to put it in perspective. A back of the envelope calculation would show that a 5-fold increase in anything in 25 years is less than 8% per annum (the spreadsheet would show 6.81%). 8% is close to the interest rate prevailing interest rates for India during this time period.
"In the first few years, CII grew only by single digits. The latest jump is of 22 points, from 497 in 2005-06. The biggest increase thus far was in 1999-2000, when CII vaulted by 38 points to reach 389."
These lines again made me wonder. Of course, the single digit growth in the initial years is a property of any price index. Since the base is low - 100 in 1981-82, as the article points out - the year-on-year (YOY) growth would be low too. That is a 9% inflation in 1982-83 would make the 1982-83 CII to 109. However, as the index grows in value to say 497, the growth would also be magnified. The 22 point jump amounts to only a 4.4% rate compared to the 9% in 1982-83. This should be good news, really, going just by this jump!!!! The 38 point increase in 1999-2000 is a 10.8% increase, not so good news. But compared to the 1982-83 inflation, it is only a 1.8% higher rate. It also would suit the prevailing conditions in the economy - the after-effects of the IT boom and all.
My interest in bringing all these numbers up is to prove just one point - it is the relative values that matter, not absolute. I have seen the same thing happen with the reporting of Sensex values as well. A 200 point rise in a day when the index is at 11000 is only less than 2% and is equal to an 80 point rise when index was at 4000.
Tuesday, August 22, 2006
The Plunge - 3
Godrej Soaps Ltd was a spin-off value play. It owned various popular brands, in addition to a contract manufacturing (CM) operation using their plant’s surplus capacity. Typically, the FMCG (Fast Moving Consumer Good) soap and cosmetic line of business is a lucrative one if the brand building has already been done. It was so in Godrej’s case (Godrej da jawaab nahin was a slogan I remembered from my early school days). Their marketing machinery was pretty good, worthy of giving a run for the money for the MNC brands. Cosmetic marketing is basically a combination of peer pressure and a scare tactic. It usually plays on the fear of being left out, whether it be Listerine initially in US on halitosis or Fair & Lovely cream with its play on not being fair being a marriage breaker.
However, the problem with Godrej was that it was hard to delineate the profitability of the FMCG business with the CM operation. CM operations tend to usually suck cash due to huge inventory needed. This is not true for FMCG business, where the cost of the inventory tends to be lower in relation to sales (the good ones have negative working capital). It is for a similar reason that conglomerates command a lower P/E than focused companies. The good thing with GSL was that the management was aware of this and decided on the spin-off. This made GSL a typical event play.
The spin-off of GSL into Godrej Industries Ltd (GIL) and Godrej Consumer Products Ltd (GCPL) happened and the release in value was almost immediate. I bought the whole entity at Rs.55. When GCPL listed, it started quoting at Rs.58 in Oct, 2001. The price at which GIL was quoting was all profit for me. However, attracted to the value of the intangibles, I was buying demerged GCPL in 2001. I ended up selling GIL for Rs.16 in Apr 02 and most of GCPL around 150 in Oct 03 attempting to release my capital.
I have tried to evaluate these two batches of GCPL differently. One being the spin-off play for my GSL purchases and the other a regular value play for GCPL stand-alone purchases. It turns out that the Spin-off play (GCPL, GIL collectively) returned me an IRR of 75% (monthly 4.8%) in a time period of less than 3 years. Excess return measured by NPV was at Rs.2,277 against my initial cost of 1,379 and future date NPV till 2004 was 3,199 at 12%. I sold the rest of GCPL(stand alone) in Feb 04 at around 182. It returned me 81.79% in 3 years with 5.11% monthly and NPV of 4,410.
However, I was in for another surprise with GCPL. I did not seem to have valued GCPL correctly when I sold it. In the 11 months, it went all the way up to 276. I have again and again sold early as my later evaluations will illustrate. It is very difficult for me to predict where value discovery process by the market stops and speculative activity begins. Hence, I take the best course of action that protects capital. I re-deploy it into other investments with better chances of success. In GCPL’s case I decided to buy again in Jan 05 at 277 and the returns till date have been stellar. An IRR of 123% in 15 months at a monthly rate of close to 7%. An NPV of 7,306!!!! However, this story has not ended yet.
The funny thing is I don’t seem to have evaluated the financials of GCPL. I need to do that to make sure I do not need to act soon at least to release my capital at current prices. The FMCG play in India seems pretty straight forward so far. The IT industry brought higher disposable income in the hands of the educated middle class. This is one of the aspects of growth in the services industry in a heavily populated country. A manufacturing led growth does not necessarily lead to growth in PDI. The value add (Price less material cost) for services is very high, especially so for IT industry. ( I am reminded of the infinite wisdom of the KGST who decided to tax the software CDs at their sale price. Either they had no concept of IP and intangibles or they didn’t care to make the difference).
The Plunge - 2
Reliance was almost a no-brainer. This company never posted a degrowth in turnover for the past few years. The EPS for FYE 2000 was Rs.22.82 which meant that I was getting one of the leading companies in India at around 13 P/E. However, my basis for buying was based on the assumption that the EPS of RIL will grow at 25% going forward and I would be able to sell it at the same P/E some years forward. 25% seemed realistic looking at the growth from 1999 to 2000. In retrospect, I made two errors due to plain ignorance.
- I assumed that the P/E ratio was reasonable considering the then prevailing interest rate environment.
- I assumed that growth would follow a linear trend.
Over the period of 4 years following, I seem to have gotten back my entire capital back through some sales (it is a strategy I follow) and still hold the same value of RIL. As on 3/31/06, it roughly translates to an annualised return of 34.5% at a monthly rate of 2.5%.
Measuring Performance
The returns I will be using here are monthly rupee weighted returns linked geometrically to produce the annual return. There are two prominent and valid methods of measuring return. One is to measure the growth of a unit of currency over a period of time and the other is to measure the return weighted for the transactions for each period. The first measure is more appropriate when calculating returns for something where the entity being measured does not have control over the cashflows. Money-weighted returns (basic as an IRR) is more appropriate where the entity measured has control over cashflows. Clearly, this method is appropriate for my purposes, since I am in charge of sale/purchase decisions and investment of cashflows.
IRR has an inherent flaw in that it assumes the cashflows are invested at the same rate throughout the period of investment. However, that may not be necessarily the case here. I may have reinvested the money in other investments which may have yielded more or less than RIL. However, the difference in measurement will vary dependant on the scale of the investment in relation to the total portfolio, the range difference in returns between the various investments in the portfolio and their interaction.
Another method, I used to measure the returns was NPV. Net Present Value is the incremental value after investing at your required return. So an NPV of 0 means that your investment returned exactly the same as your required return. Anything more would be the incremental return discounted to the initial period of investment at the required rate of return. Now, we run into the question as to what is the appropriate rate of required return.
If you follow the economist’s line of thinking that capital is scarce with alternative uses, the cost of capital is the return on next best available investment; the alternative for Indian stocks may be Indian fixed income instruments. I have looked at returns of 364-day T-bill rates. However, I am following the well researched view that Indian G-Secs are not priced appropriately to adjust for inflation appropriately due to a demand imbalance from PSU Banks. The alternative investment I could find was small savings. These are comparable, especially since the time-frame of the investment under review and the SS is almost the same. NSCs would be an appropriate instrument. Adjusting for the tax effects of taxability, deductibility and rebatability under tax laws; I am going to use an approximate rate of 12% as required return.
Back to RIL
Looking at RIL, I find that my NPV is 22,641 at 12%. This is the excess return discounted back to April 2001. The value as of April 2006 will be 39,902 (that is 22,641 invested at 12% for 5 years). Considering that my investment outgo has only been 40,618, this is a very good excess return.
Measuring Performance in Dollars
A side note – The US dollar return for all the investments under evaluation would be more than the stock’s return by around 1.4% per year and for 5 years ending 03/31/06 would be around 7% (from INR 47.69 to 44.60). This means that to calculate the US Dollar return (%) –
[(1 + S) (1 + E)] -1
where S is the Stock Return in % and E is the exchange rate gain/loss in %
At first sight, it may seem that the US Dollar return would be as easy as adding up the US Dollar gain/loss and the stock return. However, the correct way to look at it is in terms of area of a rectangle, where the S & E are the increase in the sides of the rectangle. If the length (assume S) increases with breadth remaining constant, the area would increase proportionate to the increase in length. The same is also true for an increase in breadth. However, when both S & E change, there is a corner rectangle formed by the interaction of the two as illustrated in the following diagram. In additive method of calculating US Dollar return, this smaller rectangle formed by the interaction is left out. This corner rectangle is the result of the stock gain increasing due to increase in currency return as well.
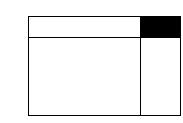
In RIL’s case, US Dollar return would be 36.37% [(1 + .345) (1 + .014)-1]
So much for history of RIL, the question now to be considered is will RIL continue to deliver similar stellar performance in the next 5 years?
The Plunge - 1
Reliance Industries Ltd (http://www.ril.com/) - 10 shares at Rs.300 – Rs.3,007.50
Godrej Soaps Ltd – 25 shares at Rs.55 – Rs.1,378.50.
Sunday, August 20, 2006
Testing the Waters
My initial experience in buying stocks in the secondary markets had been a disaster. Circa 1996 (I wasn’t even 20 then), I audited a stockbroker for my employer and established a business relationship with them. I scoured through ET stock pages and bought two stocks. My criterion was that they were trading near their 52-week lows. (Behavioral Finance calls it Reference Point behavior). Of course, I didn’t bother to check if there was any valid reason for such a price behavior. Here are the purchase prices:-
GR Magnets Ltd – 100 shares at Rs.8.72 per share
Goodearth Organics Ltd – 100 shares at Rs.1.00 (approximately) per share
I don’t exactly recall the price I paid for Goodearth. I just know that I paid less than a 1000 to the broker in settlement.
When I placed the order, the lady at the broker’s asks me – did I know that GR Magnets’ Managing Director was arrested for FERA violations (foreign exchange laws)? Of course, I had no idea. But, I nodded along.
Electronic trading and demat were unheard of these days. The broker delivered to me a share certificate with attached transfer deed, where the seller had signed his name and with a few other prior parties’ signatures. I had no idea of the timing of the sale. So, when asked I said I wanted it transferred to my name. (It didn’t occur to me to ask for alternatives – I could have held on to the transfer deed and get it revalidated after three months, if I didn’t sell it by then. Three months, I think, was the time limit to hold the deed without sending it to the company). So I filled out the forms and send it on its merry way to the companies to get the shares transferred.
Here’s the rest of the story:-
GR Magnets – bounced up to Rs.20 within 2-3 months. Good call, I thought. However, there was one hitch. I didn’t have the shares with me to sell it. It was with the company to be transferred. By the time I got the shares back, the scrip was moved to the Z list (equivalent of having the bad boys of the class sit in the backbenches) and was trading way below my purchase price. The last quoted price was close to Rs.1. I still have this certificate and am thinking of framing it as a not-so gentle reminder of my follies of indiscretion.
Goodearth Organics – never saw a bounce, never saw the certificate again.
It was a great practical lesson in bad deliveries for me. I stayed away from the markets for the next five years, until demat came into existence.


 Posts
Posts