Glaxo Smithkline Beecham
Coincidentally, I started buying Glaxo also on the same day. Glaxo was also a de-regulation play, in a sense. Most of the medical drugs in India at the time were under the Drug Price Control Order (DPCO), whereby the government controlled the prices at which drug companies could sell their products to consumers. As a result, the profits were depressed artificially. I looked at Glaxo and there was not much in the form of book value for my downside protection. It was around 66 and the share was trading around 400 at the time. The book value did not include the value of drug patents available in the quiver of its parent, which held controlling interest in the Indian company. The company had grown its book value @ 6% per year for the last 8 years and had an ROE of 13% pre-merger.
Glaxo came to my attention for one reason. I used to buy diabetes medicine for my grandmother on a regular basis. She swore by a pill called Diaonil prescribed to her by her doctor. If this was the case for a 70-odd year old lady with only basic education, I wondered about the rest. I found out that Glaxo marketed this drug. Later, talking to a friend who was a medical representative, I got a good understanding of the business model of the drug companies operating in India.
There were some other metrics that pointed to the direction the company was taking. There was also the proposed merger with Smith-Kline Beecham during the year. And a quick growth was in sight. I admit, there was nothing much in the balance sheet pointing towards a great share. Despite that I ended up buying it at an average cost of around 318 till Jan 03. By the end of 2003, I had a two-bagger in my hand and by March 06, it was at 1450. I had sold part of my holdings by the end of 2004 to retrieve capital. Looking at values till March 06, I had an IRR of 43.74% and an NPV of 23,143 on an investment much less than that.

Custom Search
Friday, November 17, 2006
Divergent Paths - 2
Bharat Petroleum Corporation Ltd
BPCL was a de-regulation play. The government had dismantled the APM mechanism through which subsidies were distributed to oil companies to keep the petroleum product prices down. I had friends who audited one of the local refineries and had heard war stories about the mechanism. Now, the companies were free to set their own prices; or so, it seemed.
Based on the 2000 financials, the book value of BPCL was at Rs.232.98 per share. However, that was of not much use to me since they had done a 1:1 bonus issue (stock dividend) during the year. By a reasonable estimate, the book value would have been around 130 considering the growth during the year. However, the enterprise value (EV) of the company seemed to be around 250 per share, which was what I was hoping, would come to my rescue. The relevance of EV is that BPCL would not have had to face competition from other MNC oil companies when they entered, since it would have been easier for them to buy BPCL at 233 or less per share and use the control to capture the Indian market. If they decided to build a new refinery and establish the same infrastructure that BPCL already had, it would take time as well as more money to compete. Inflation was working for me for a change. The other factor was the EV/PBIDT ratio looked pretty good at 3.4 times for 2000, which means that a deep pocket buyer could buy all of the shares of BPCL from the market and pay down all of the debt in the balance sheet and come-up with about 20% return on the total equity. (20% is approximated by inverting 3.4 and adding for tax protection of debt, since interest is tax deductible and profits are not).
Initially the new system of market pricing seemed to work. In FY 2003, BPCL posted a decent year with a 47% growth in EPS. Return on Total Assets (ROTA) went up by 42% that year from around 11% to 15%. Operating efficiency seemed to have caused the growth in EPS.
There are two components of efficiency for most manufacturing companies – operating and production efficiency. The Operating efficiency is measurable as a ration of EBIT to Value Add (Value add is calculated by deducting the material cost from sales. As the term implies, this represents the value added by the operations of the company). For oil companies, this component is called marketing margins, since this represents a higher price realization for them. This is the component of the price charged for making the by-products of crude available at the pump. There is also the component of Production efficiency (called Refining Margins for oil companies) which can be calculated as the ratio of Value Add to Sales. This is the component of the price charged for converting the raw crude to its various by-products.
BPCL seemed to have improved its marketing margins that year to compensate for a slight decrease in the refining margins. However, something that puzzled me was the increase in the inventory turnover. It had gone down by about 19% from 14 to 11.
For a manufacturing-cum-retail operation, there are two key factors/cycles that determine its ability to generate cash. One is the manufacturing cycle, which is a function of the throughput time, wherein raw material is converted to finished product. Second, shared with any product/sales operation, is the working capital cycle wherein cash is used to buy materials which are sold to customers to become receivables and later converted back to cash. These two critical cycles determine the cash generating ability of any operation.
As an aside, the beauty of the software companies that work on a turn-key or T&M basis is that they don’t have the first cycle and they have a short second cycle with a higher margin.
The efficiency of the cash generation is dependant on two factors – one is the margin in the cycle and second is the speed of the cycle. When I was a kid, I remember seeing the manually pedaled irrigation wheel looking something like this . It would have a big wheel with buckets at even intervals. It worked like a smaller version of the ferris wheel. It was pedal operated or animal operated and the buckets would fetch water from a lower level to the fields. I saw these two cycles the same way. The margins represent the depth of the buckets. A smart farmer could figure out that the quantity of water he would irrigate would depend on the size of the bucket and the speed of the wheel. The cycles in the product business are similar – the faster turn and higher margins assure more cash generation.
For BPCL, the buckets had deepened. However, the pace of rotation had gone slower in one area. The pace is measured by the asset turnover ratio which is Turnover divided by total assets. This can be further broken down into: Fixed Asset Turnover, Inventory Turnover, Receivables Turnover and Cash Turnover ratios. These are ratios of sales to fixed assets, inventory, receivables and cash respectively. The component turnover ratios are a way of looking at the pace at different stages of the cycle. For BPCL, there was a slow-down in the inventory side (which meant that inventory was higher in relation to sales) and a growth in the receivables side (meant faster collection). The higher receivables turnover more than offset the slow-down due to inventory accumulation. The asset turnover was higher by 19%. This is typical when you have a year of high growth.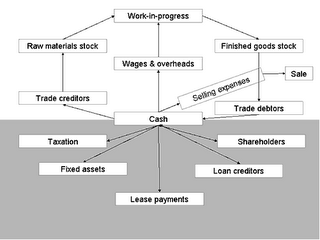
Another way of looking at these is the number of days the working capital cycle takes. It can be approximated by converting these component ratios into number of days by dividing 365 by these ratios. In BPCL’s case, it had actually declined from net 32 days to 39 days. The 7 days seemed to be on the inventory side. However, this was no cause for much concern.
The party did not last as long as I expected. The pooper turned out to be crude oil prices. The trouble with dealing in a commodity like petroleum products is that its demand is inelastic. In layman’s terms, it means that people don’t buy less of petrol (gasoline), diesel etc., just because the prices went up by a few cents; at least over a short-term. Over a longer period of time, the car companies may market more fuel-efficient cars aggressively and technological innovations like the hybrid/electric cars may pop-up. But it takes a long time for all these to happen. And, when this happens, the beneficiary definitely wouldn’t be a non-integrated refiner who buys crude from another business and sells at soft-regulated prices.
I started buying BPCL in April 01 and kept on buying all the way till 2002. My average price was around Rs.200 per share, which gave me a good margin of safety from the EV of around Rs.250 or more. For some time, my thesis seemed to have worked out pretty well. The shares traded at a high of 520 by Jan and remained thereabouts till April 04. After that, the bottom seemed to drop out and the shares went all the way to 330 levels and seemed to stage a small rally through Jan 05 and back down again at 360 levels by the end of April 05. I sold some of the shares by the end of November 04 at around 394. It started another climb from the 340 levels and I sold most of the rest around 365. By the time I exited most of the position in Aug. ’05, I had made an IRR of 21% including dividends with an NPV of 4614 at the 12% required rate. Phew!!! What a roller-coaster ride.
BPCL was a de-regulation play. The government had dismantled the APM mechanism through which subsidies were distributed to oil companies to keep the petroleum product prices down. I had friends who audited one of the local refineries and had heard war stories about the mechanism. Now, the companies were free to set their own prices; or so, it seemed.
Based on the 2000 financials, the book value of BPCL was at Rs.232.98 per share. However, that was of not much use to me since they had done a 1:1 bonus issue (stock dividend) during the year. By a reasonable estimate, the book value would have been around 130 considering the growth during the year. However, the enterprise value (EV) of the company seemed to be around 250 per share, which was what I was hoping, would come to my rescue. The relevance of EV is that BPCL would not have had to face competition from other MNC oil companies when they entered, since it would have been easier for them to buy BPCL at 233 or less per share and use the control to capture the Indian market. If they decided to build a new refinery and establish the same infrastructure that BPCL already had, it would take time as well as more money to compete. Inflation was working for me for a change. The other factor was the EV/PBIDT ratio looked pretty good at 3.4 times for 2000, which means that a deep pocket buyer could buy all of the shares of BPCL from the market and pay down all of the debt in the balance sheet and come-up with about 20% return on the total equity. (20% is approximated by inverting 3.4 and adding for tax protection of debt, since interest is tax deductible and profits are not).
Initially the new system of market pricing seemed to work. In FY 2003, BPCL posted a decent year with a 47% growth in EPS. Return on Total Assets (ROTA) went up by 42% that year from around 11% to 15%. Operating efficiency seemed to have caused the growth in EPS.
There are two components of efficiency for most manufacturing companies – operating and production efficiency. The Operating efficiency is measurable as a ration of EBIT to Value Add (Value add is calculated by deducting the material cost from sales. As the term implies, this represents the value added by the operations of the company). For oil companies, this component is called marketing margins, since this represents a higher price realization for them. This is the component of the price charged for making the by-products of crude available at the pump. There is also the component of Production efficiency (called Refining Margins for oil companies) which can be calculated as the ratio of Value Add to Sales. This is the component of the price charged for converting the raw crude to its various by-products.
BPCL seemed to have improved its marketing margins that year to compensate for a slight decrease in the refining margins. However, something that puzzled me was the increase in the inventory turnover. It had gone down by about 19% from 14 to 11.
For a manufacturing-cum-retail operation, there are two key factors/cycles that determine its ability to generate cash. One is the manufacturing cycle, which is a function of the throughput time, wherein raw material is converted to finished product. Second, shared with any product/sales operation, is the working capital cycle wherein cash is used to buy materials which are sold to customers to become receivables and later converted back to cash. These two critical cycles determine the cash generating ability of any operation.
As an aside, the beauty of the software companies that work on a turn-key or T&M basis is that they don’t have the first cycle and they have a short second cycle with a higher margin.
The efficiency of the cash generation is dependant on two factors – one is the margin in the cycle and second is the speed of the cycle. When I was a kid, I remember seeing the manually pedaled irrigation wheel looking something like this .
 It would have a big wheel with buckets at even intervals. It worked like a smaller version of the ferris wheel. It was pedal operated or animal operated and the buckets would fetch water from a lower level to the fields. I saw these two cycles the same way. The margins represent the depth of the buckets. A smart farmer could figure out that the quantity of water he would irrigate would depend on the size of the bucket and the speed of the wheel. The cycles in the product business are similar – the faster turn and higher margins assure more cash generation.
For BPCL, the buckets had deepened. However, the pace of rotation had gone slower in one area. The pace is measured by the asset turnover ratio which is Turnover divided by total assets. This can be further broken down into: Fixed Asset Turnover, Inventory Turnover, Receivables Turnover and Cash Turnover ratios. These are ratios of sales to fixed assets, inventory, receivables and cash respectively. The component turnover ratios are a way of looking at the pace at different stages of the cycle. For BPCL, there was a slow-down in the inventory side (which meant that inventory was higher in relation to sales) and a growth in the receivables side (meant faster collection). The higher receivables turnover more than offset the slow-down due to inventory accumulation. The asset turnover was higher by 19%. This is typical when you have a year of high growth.
Another way of looking at these is the number of days the working capital cycle takes. It can be approximated by converting these component ratios into number of days by dividing 365 by these ratios. In BPCL’s case, it had actually declined from net 32 days to 39 days. The 7 days seemed to be on the inventory side. However, this was no cause for much concern.
The party did not last as long as I expected. The pooper turned out to be crude oil prices. The trouble with dealing in a commodity like petroleum products is that its demand is inelastic. In layman’s terms, it means that people don’t buy less of petrol (gasoline), diesel etc., just because the prices went up by a few cents; at least over a short-term. Over a longer period of time, the car companies may market more fuel-efficient cars aggressively and technological innovations like the hybrid/electric cars may pop-up. But it takes a long time for all these to happen. And, when this happens, the beneficiary definitely wouldn’t be a non-integrated refiner who buys crude from another business and sells at soft-regulated prices.
I started buying BPCL in April 01 and kept on buying all the way till 2002. My average price was around Rs.200 per share, which gave me a good margin of safety from the EV of around Rs.250 or more. For some time, my thesis seemed to have worked out pretty well. The shares traded at a high of 520 by Jan and remained thereabouts till April 04. After that, the bottom seemed to drop out and the shares went all the way to 330 levels and seemed to stage a small rally through Jan 05 and back down again at 360 levels by the end of April 05. I sold some of the shares by the end of November 04 at around 394. It started another climb from the 340 levels and I sold most of the rest around 365. By the time I exited most of the position in Aug. ’05, I had made an IRR of 21% including dividends with an NPV of 4614 at the 12% required rate. Phew!!! What a roller-coaster ride.
Divergent Paths - 1
The next two scrips I bought couldn’t have taken a more divergent path. One was a good cautionary lesson in investing in government companies. Though I didn’t lose the capital, the opportunity cost was heavy.
Subscribe to:
Posts (Atom)